geodemographic-india-llm
From Numbers to Narratives: LLM-Augmented Geodemographic Classification of Demographic Dividend Potential in Indian Districts using National Family Health Survey (NFHS)-5, India Dataset
Study Area: India - 36 States & Union Territories | Survey Period: 2019-2021 | Platform: Python + Google Colab + Anthropic API
Can Large Language Models translate complex demographic cluster profiles into accurate, policy-ready narratives- and can we systematically measure the quality and bias of what they produce?
About This Project
This repository presents a reproducible, end-to-end geodemographic intelligence pipeline that classifies all 707 Indian districts by demographic dividend potential and uses Large Language Models to automatically generate policy-ready narratives for each cluster type.
The analysis fuses two independently sourced datasets:
- NFHS-5 (2019–21): India’s most granular national health survey - 707 districts × 109 indicators spanning fertility, maternal health, child nutrition, women’s empowerment, and living standards
- Census 2011 District Boundaries: Open-source shapefiles for spatial mapping and interactive cartography
The pipeline proceeds in two stages. The first stage applies a standard geodemographic workflow: Z-score standardisation → PCA → k-means clustering → index score profiling - to classify districts into four demographically coherent cluster types. The second stage passes each cluster’s statistical profile to Claude (Anthropic API) using three distinct prompt engineering strategies, generating plain-language narratives that district planners, health officers, and policymakers can directly use.
The project then systematically evaluates LLM output across three dimensions: semantic consistency (do the three strategies describe the same demographic reality?), language bias (does theoretical grounding reduce deficit framing?), and factual accuracy (does the model correctly identify transition stage?).
🗺️ Live District Explorer - The interactive choropleth map renders as a fully functional district-level portal. Hover over any of the 694 mapped districts to query cluster assignment, transition stage, and key indicator values in real time: Open Live Portal →
Table of Contents
- Rationale
- Aims and Objectives
- Datasets
- Methodology at a Glance
- Geodemographic Classification Results
- LLM Narrative Generation
- Evaluation Results
- Key Findings
- Project Structure
- How to Reproduce
- Dependencies
- References
Rationale
The Global Challenge: Data-Rich, Insight-Poor
The twenty-first century has seen an unprecedented accumulation of demographic and health data, yet the core challenge remains: translating data into understanding, and understanding into action. The gap is not technical - the tools and data exist. It is communicative. The people who need to act on demographic intelligence rarely speak the language of PCA biplots or index score heatmaps. District magistrates, block-level health officers, and state legislators need narratives, not matrices.
This problem is sharpest in low- and middle-income nations, precisely where demographic change is most consequential, and where the interpretive infrastructure that higher-income countries take for granted- policy briefs, typologies, evidence syntheses- is thinnest.
The Demographic Dividend: A Closing Window
- As countries transition from high to low fertility, a window of 2-3 decades opens where the working-age population is large relative to dependents
- If this cohort is educated, healthy, and employable, the dividend materialises as accelerated economic growth; if not, the window closes unrealised
- South and Southeast Asia are mid-transition; Sub-Saharan Africa is entering it
- The policy decisions of the next 10-15 years on girls’ education, reproductive health, and child nutrition will determine whether the dividend is captured or squandered
- Demographic transition is not national - it plays out at district and block level, and national-level data actively masks this heterogeneity
India as a Critical Case
- 1.4 billion people, 36 states and Union Territories, 740 districts, simultaneously at early, mid, and late transition stages
- Bihar and Meghalaya resemble sub-Saharan Africa circa the 1990s; Tamil Nadu and Kerala are already managing an ageing population
- Despite this, no reproducible, openly published geodemographic typology of Indian districts exists framed around demographic dividend potential
- The UK has the Output Area Classification (OAC); the US has PRIZM and Mosaic; India has no district-level equivalent
The LLM Opportunity and the Risk
- LLMs offer, for the first time, a mechanism to automatically convert statistical cluster profiles into plain-language narratives that policymakers can read and act on
- But LLMs trained on Global North corpora carry embedded assumptions about “development” and “progress”, risking narratives that reinforce deficit framings, stigmatise historically disadvantaged regions, or present structural inequality as cultural pathology
- This risk is largely unevaluated, especially for place-based characterisation in Global South contexts
What This Project Does
Builds the first openly reproducible geodemographic classification of Indian districts framed around demographic dividend potential using NFHS-5 (2019-21), then uses it as a test bed to systematically evaluate LLMs as narrative interpreters of demographic data - comparing three prompt engineering strategies across accuracy, semantic consistency, and language bias.
Aims and Objectives
Primary Aim: To develop, evaluate, and openly publish a reproducible geodemographic classification of Indian districts based on NFHS-5 indicators, augmented by LLM-generated narrative descriptions of each cluster type.
Objectives:
| # | Objective |
|---|---|
| 1 | Select and justify a theoretically grounded set of NFHS-5 variables capturing demographic transition across five domains: age structure, women’s empowerment, maternal health, child health, and living standards |
| 2 | Apply a standard geodemographic pipeline (standardisation → PCA → k-means → index scoring) to classify all 707 districts into geodemographic cluster types |
| 3 | Map the classification spatially to reveal geographic patterns of demographic dividend potential across India |
| 4 | Design and compare three prompt engineering strategies (Basic, Theory-Grounded, Structured + Bias-Aware) for LLM-generated narrative descriptions of each cluster |
| 5 | Evaluate LLM output quality through semantic consistency analysis, bias auditing, and factual accuracy checking |
| 6 | Produce an openly reproducible, fully documented codebase that can be extended to future NFHS rounds or adapted for other national survey datasets |
Datasets
1. NFHS-5 District Factsheet Data (2019-21)
| Attribute | Detail |
|---|---|
| Full name | National Family Health Survey - Round 5 |
| Coverage | 707 districts across 36 States and Union Territories of India |
| Variables available | 109 demographic, health, nutrition, and living standards indicators |
| Variables used | 19 (selected across 5 thematic domains) |
| Reference period | 2019-2021 |
| Publisher | International Institute for Population Sciences (IIPS) and ICF, Ministry of Health and Family Welfare, Government of India |
| Missing values | 0 - complete data for all 19 selected variables across all 707 districts |
📥 Download from data.gov.in - NFHS-5 India Districts Factsheet Data (Provisional) India’s Open Government Data Platform - official, freely accessible, no login required
📄 Full NFHS-5 India Report Complete methodology, questionnaires, and national/state-level findings
🌐 NFHS-5 District Factsheets Portal (IIPS) State-wise downloadable PDFs and the compiled district factsheet Excel file
NFHS is India’s implementation of the global DHS (Demographic and Health Survey) programme. Round 5 (2019-21) is the most geographically granular national health survey conducted in India to date - the first round to cover all districts - making it the definitive source for sub-national demographic analysis.
Variables selected across 5 thematic domains:
Domain 1 - Age Structure & Fertility
  ├── Population below age 15 years (%)
  ├── Sex ratio of total population (females per 1,000 males)
  ├── Sex ratio at birth (females per 1,000 males)
  ├── Women age 15-19 already mothers or pregnant (%)
  └── Women age 20-24 married before age 18 (%)

Domain 2 - Women's Empowerment
  ├── Women age 15-49 who are literate (%)
  ├── Women age 15-49 with 10+ years of schooling (%)
  ├── Currently married women using any modern FP method (%)
  └── Total unmet need for family planning (%)

Domain 3 - Maternal Health Services
  ├── Mothers with ANC check-up in first trimester (%)
  ├── Mothers with 4+ antenatal care visits (%)
  └── Institutional births in last 5 years (%)

Domain 4 - Child Health & Nutrition
  ├── Children age 12-23 months fully vaccinated (%)
  ├── Children under 5 who are stunted (%)
  ├── Children under 5 who are underweight (%)
  └── All women age 15-49 who are anaemic (%)

Domain 5 - Living Standards & Access
  ├── Households using improved sanitation facility (%)
  ├── Households using clean fuel for cooking (%)
  └── Households with health insurance coverage (%)
2. India District Boundary Shapefile (Census 2011)
| Attribute | Detail |
|---|---|
| Source | Census of India 2011, Survey of India |
| Repository | datameet/maps - open community GIS repository |
| Projection | WGS84 / EPSG:4326 |
| Districts geocoded | 694 of 707 NFHS-5 districts (via fuzzy name matching) |
🗺️ Download from datameet/maps - Census 2011 District Boundaries Open-source, community-maintained shapefile for all Indian districts
Methodology at a Glance
NFHS-5 District Data  (707 districts x 109 variables)
              |
              v
     Variable Selection
     19 variables · 5 thematic domains
     Theoretically grounded · policy-actionable
              |
              v
     Z-Score Standardisation
     Zero mean · unit variance
              |
              v
     Principal Component Analysis
     Retain components explaining 80% variance
     PC1 = demographic transition axis
     PC2 = service access axis
              |
              v
     K-Means Clustering  (k = 3-9 tested)
     Optimal k by silhouette score + elbow method
     100 random initialisations for stability
              |
              v
     Index Score Profiling
     (Cluster Mean / National Mean) x 100
              |
              v
     Geospatial Mapping
     Static choropleth + interactive Folium map
              |
              v
     LLM Narrative Generation
     3 prompt strategies x 4 clusters
     Claude claude-sonnet-4-6 via Anthropic API
              |
              v
     Evaluation
     ├── Semantic consistency  (cosine similarity)
     ├── Bias audit            (lexical frequency)
     └── Factual accuracy      (V3 vs ground truth)
Geodemographic Classification Results
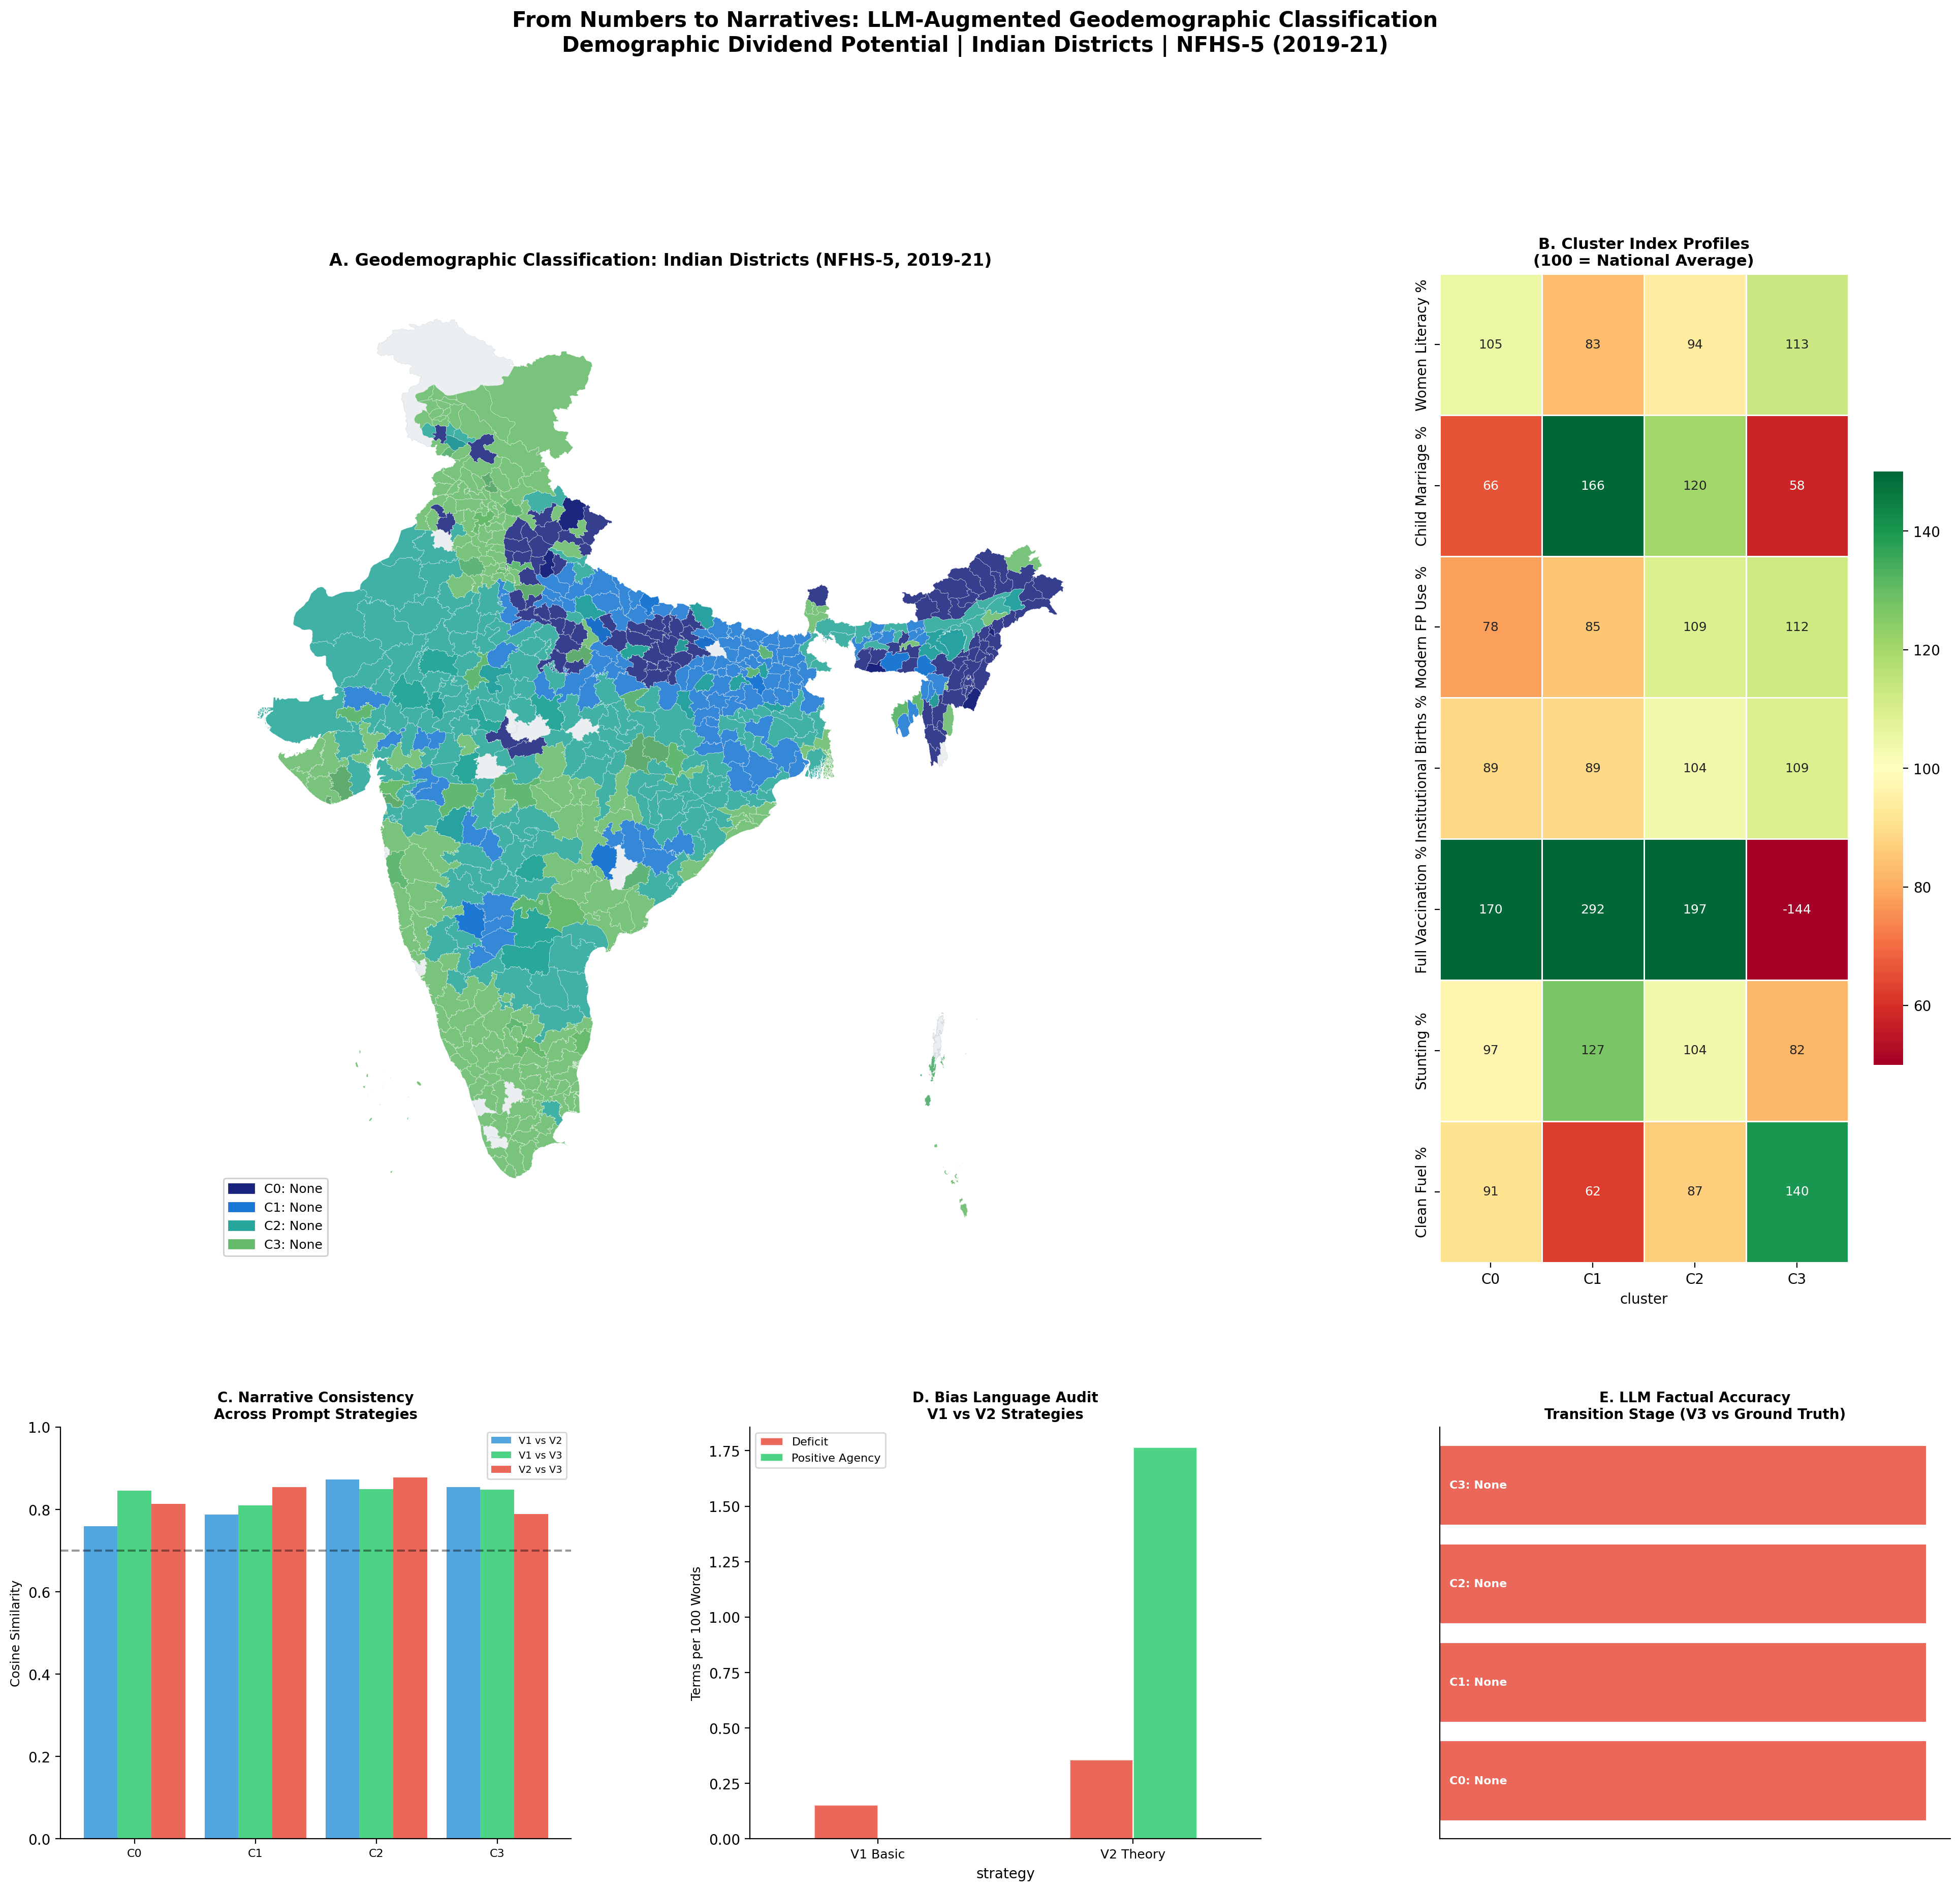
The optimal solution was k = 4 clusters, selected by silhouette analysis, classifying 694 districts across all 36 states and Union Territories.
Cluster Index Score Heatmap
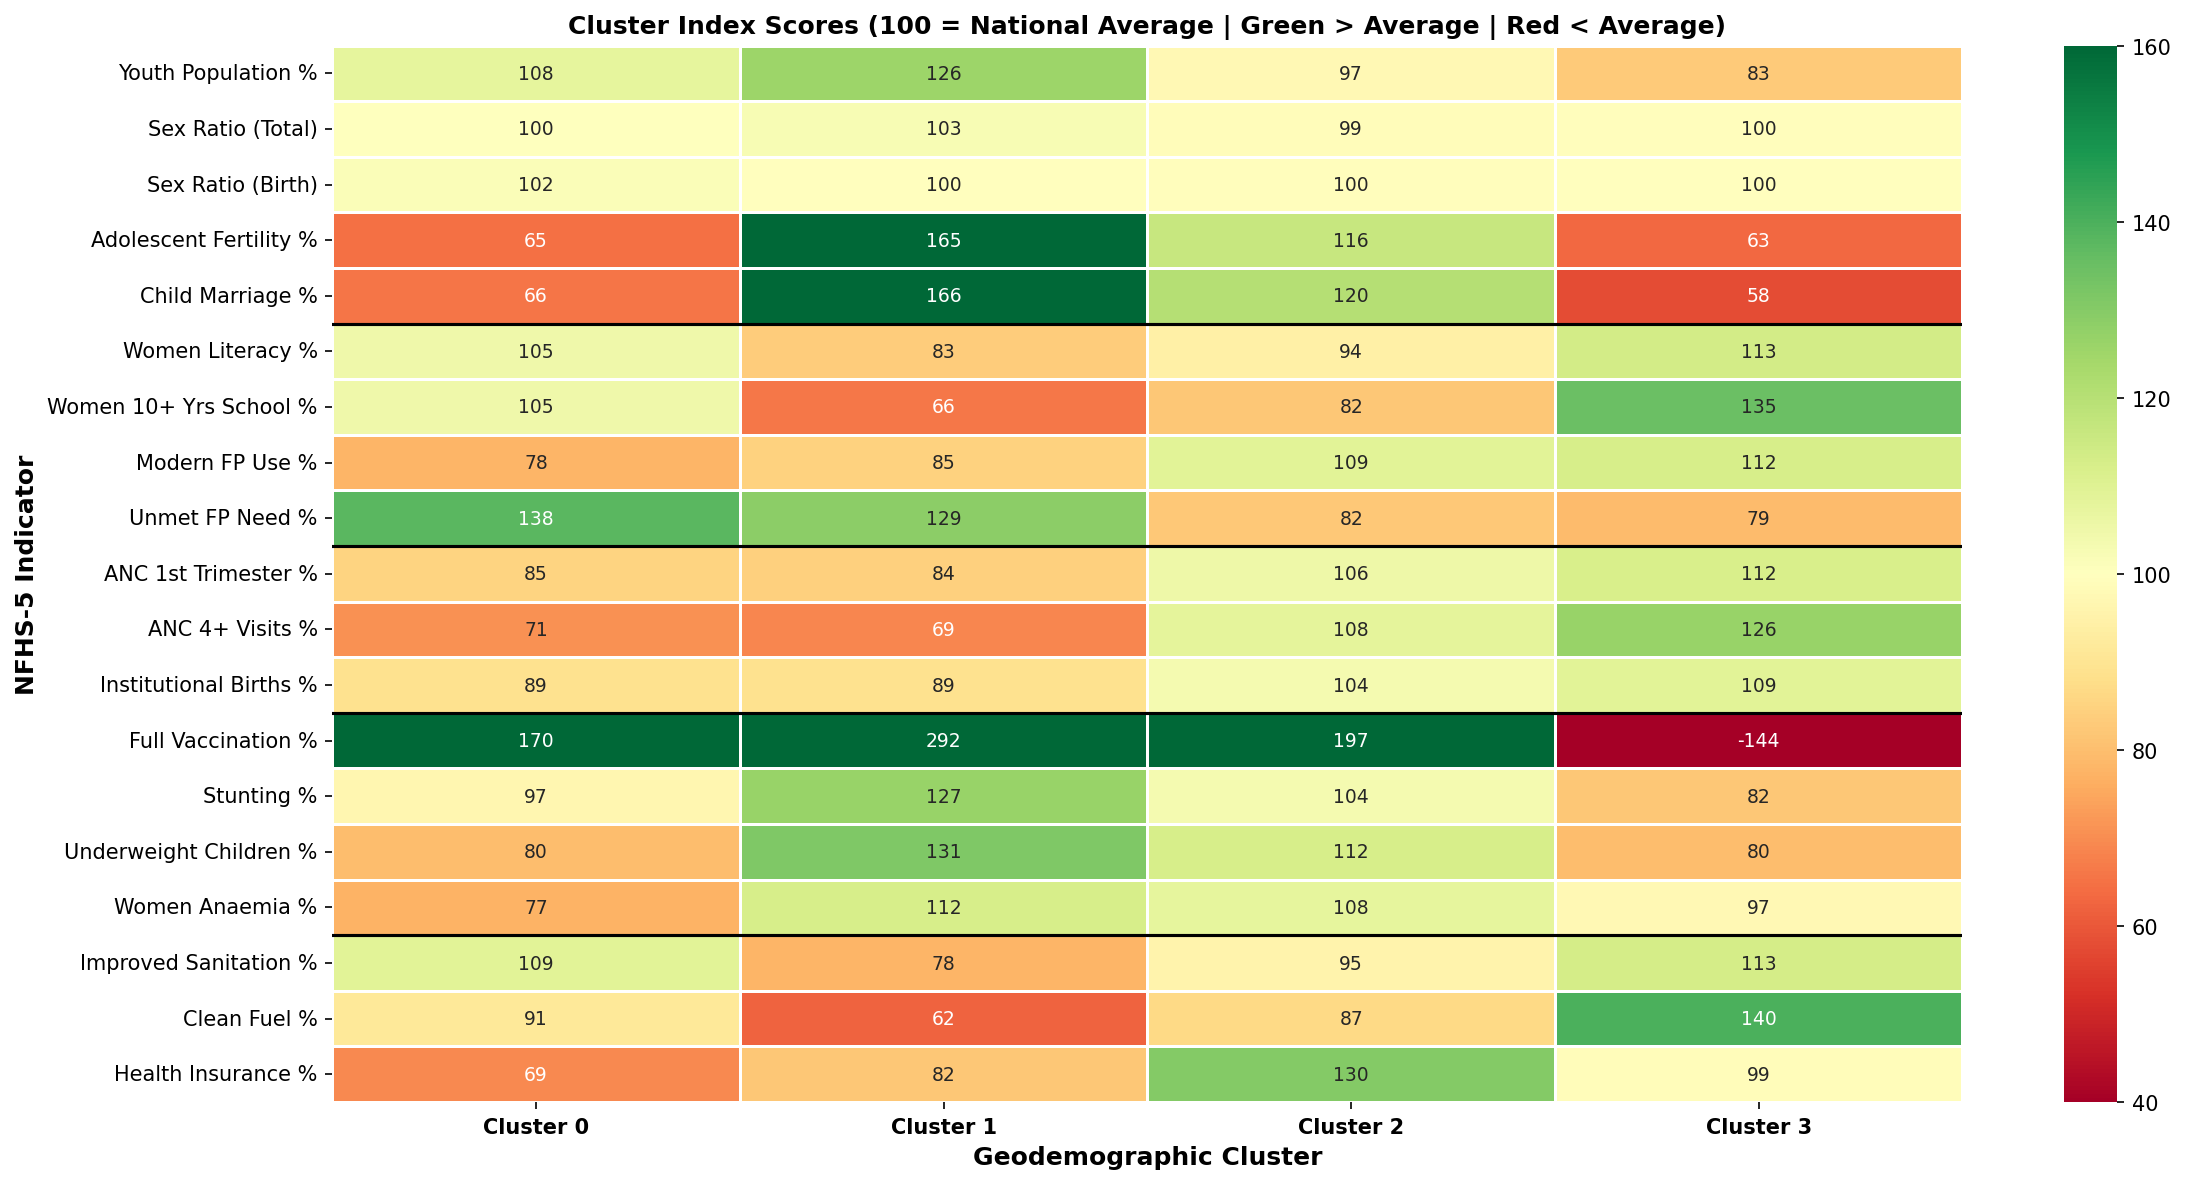
Each cell shows the cluster mean as an index relative to the national average (100 = national mean). Green = above average · Red = below average. The stronger the divergence from 100, the more that indicator defines the cluster’s character.
Cluster 0: “Transitional Highlands with Unfinished Foundations” · 117 districts
States: Uttar Pradesh · Arunachal Pradesh · Nagaland · Manipur Stage: Mid-transition | Dividend Potential: Moderate
Adolescent fertility (index 65) and child marriage (index 66) are well below the national average - unusual for a cluster spanning UP - reflecting the northeastern states’ historically stronger gender norms. Full vaccination coverage is exceptionally high (index 170), indicating effective community health worker reach. Yet unmet family planning need is 38% above average (index 138) and ANC 4+ visits are below average (index 71): immunisation infrastructure is strong, but reproductive health integration lags. Health insurance coverage is the lowest of all clusters (index 69).
Cluster 1: “High Fertility, Low Education Transition Zone” · 139 districts
States: Bihar · Uttar Pradesh · Jharkhand · Assam Stage: Early transition | Dividend Potential: Emerging
Child marriage affects 34.5% of women (index 166). Adolescent fertility is 65% above the national norm. Only 26.4% of women have 10+ years of schooling (index 66). Women’s anaemia at 63.0% and child stunting at 42.6% signal persistent nutritional stress. The dividend window remains open but requires urgent investment in girls’ education and reproductive health access. The cluster’s most striking data point - a full vaccination index of 292 - reveals that community health worker networks function effectively even here, representing an untapped platform for integrated outreach.
Cluster 2: “Mid-Transition High Institutional Care Districts” · 211 districts
States: Madhya Pradesh · Rajasthan · Gujarat · Odisha Stage: Mid-transition | Dividend Potential: Emerging
Health service delivery is mature: institutional births at 91.7%, modern FP use at 59.6%, vaccination well above average (index 197). Yet child marriage still affects one in four women (25.0%), only 32.8% of women have 10+ years of schooling, and women’s anaemia stands at 60.3%. Health systems have scaled; human capital formation has not kept pace. Without closing this gap, the dividend risks being only partially realised.
Cluster 3: “Advanced Transition, Persistent Health Gaps” · 227 districts
States: Tamil Nadu · Karnataka · Haryana · Punjab Stage: Late transition | Dividend Potential: Realised
53.9% of women have 10+ years of schooling (index 135 - highest in the dataset). Child marriage at 12.0% and adolescent fertility at 3.9% are well below national norms. Institutional births near-universal at 96.6%. The dividend has largely been realised. Women’s anaemia (index 97) and child stunting (index 82) indicate that even the most advanced districts carry a nutritional burden that education and FP gains alone do not resolve. The full vaccination index score of -144 is arithmetically impossible - a data coding anomaly independently flagged by the V3 LLM output before any manual review.
Cluster Comparison Table
| Indicator (Index: 100 = National Average) | C0 | C1 | C2 | C3 |
|---|---|---|---|---|
| Youth Population % | 108 | 126 | 97 | 83 |
| Adolescent Fertility % | 65 | 165 | 116 | 63 |
| Child Marriage % | 66 | 166 | 120 | 58 |
| Women Literacy % | 105 | 83 | 94 | 113 |
| Women 10+ Yrs School % | 105 | 66 | 82 | 135 |
| Modern FP Use % | 78 | 85 | 109 | 112 |
| Unmet FP Need % | 138 | 129 | 82 | 79 |
| Institutional Births % | 89 | 89 | 104 | 109 |
| Full Vaccination % | 170 | 292 | 197 | -144* |
| Stunting % | 97 | 127 | 104 | 82 |
| Women Anaemia % | 77 | 112 | 108 | 97 |
| Clean Fuel % | 91 | 62 | 87 | 140 |
| Health Insurance % | 69 | 82 | 130 | 99 |
* Anomalous value - likely a data coding issue in source NFHS-5 factsheet. Flagged independently by V3 LLM. Bold = index >= 115 or <= 85.
LLM Narrative Generation
Three prompt strategies were designed to test different dimensions of LLM capability on geodemographic data:
| Strategy | Design | Tests |
|---|---|---|
| V1 Basic | Minimal: provide cluster profile, request 150-word planning narrative | Baseline with no theoretical guidance |
| V2 Theory-Grounded | Embed demographic transition theory; request stage identification, policy priorities, cluster label | Does theory-grounding improve accuracy and policy relevance? |
| V3 Structured + Bias-Aware | Request structured JSON with 10 fields including a bias_flag asking the model to identify stereotypes its description might reinforce |
Does structured prompting reduce hallucination and surface ethical risks? |
Sample - Cluster 1 comparison:
V1 Basic: “These 139 districts, spanning Bihar, Uttar Pradesh, Jharkhand, and Assam, represent a concentration of interconnected demographic and public health challenges. Child marriage affects more than one in three women (34.5%), at 66% above the national average…”
V2 Theory-Grounded: “These districts exhibit characteristics of early-to-mid demographic transition, marked by persistently high fertility and significant child undernutrition alongside only partial improvements in institutional care. The demographic dividend window remains open but requires urgent investment in girls’ secondary education to avoid closing before it is realised…”
V3 bias_flag output: “Risk of reinforcing BIMARU-region stereotypes. Description may inadvertently frame structural disadvantage as cultural deficit rather than as a consequence of historical underinvestment in education and health infrastructure.”
Evaluation Results
Semantic Consistency
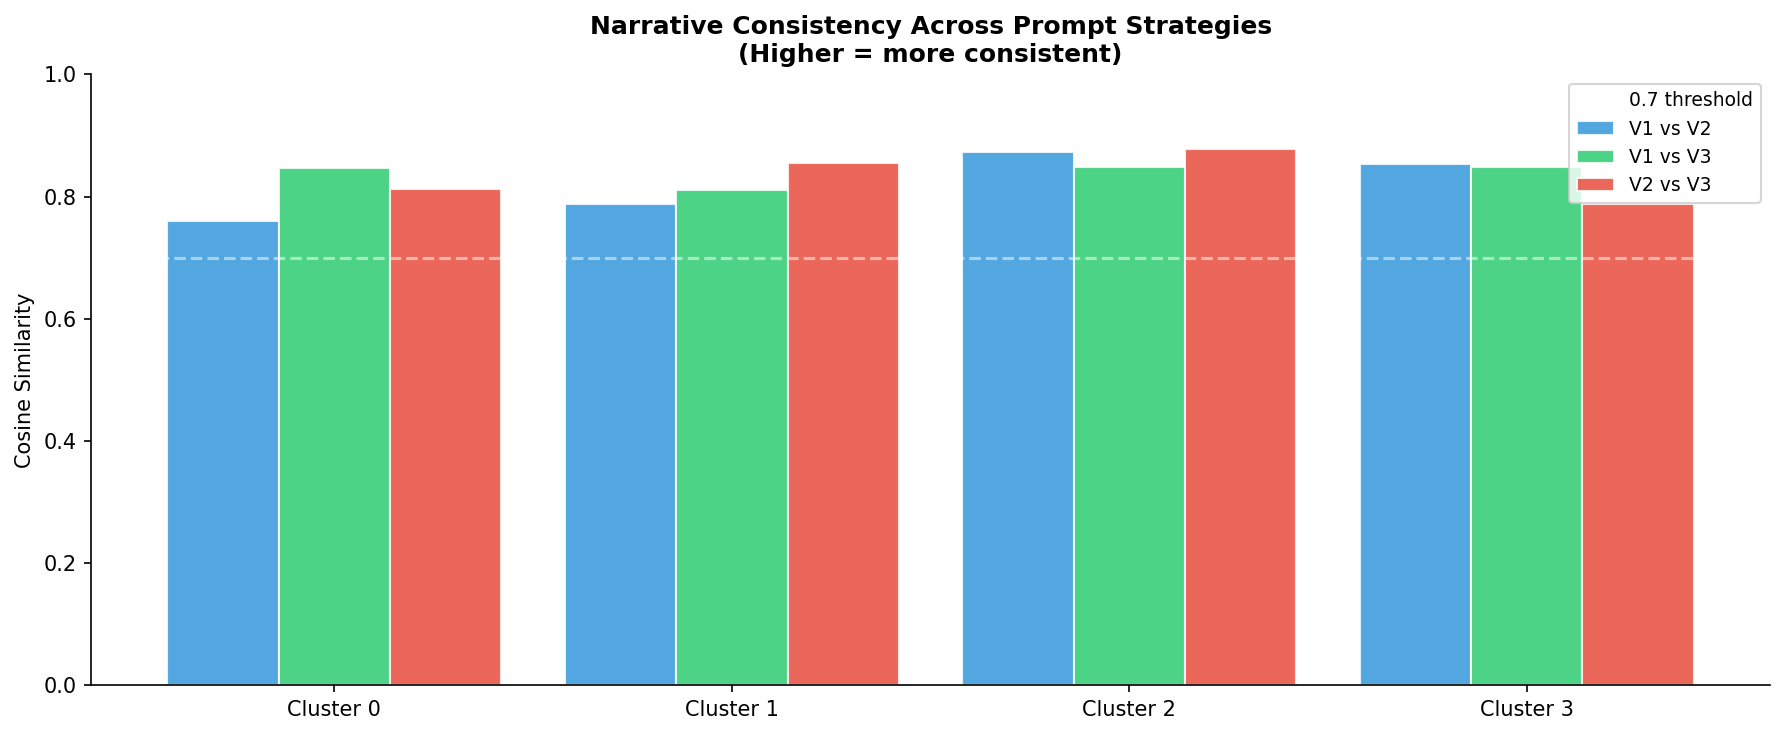
Cosine similarity computed between sentence-embedding representations (all-MiniLM-L6-v2) of each strategy-pair narrative:
| Cluster | V1 vs V2 | V1 vs V3 | V2 vs V3 |
|---|---|---|---|
| Cluster 0 | 0.76 | 0.85 | 0.81 |
| Cluster 1 | 0.79 | 0.81 | 0.86 |
| Cluster 2 | 0.88 | 0.85 | 0.88 |
| Cluster 3 | 0.86 | 0.85 | 0.80 |
| Mean | 0.82 | 0.84 | 0.84 |
All pairwise similarities exceed the 0.70 good-agreement threshold. The semantic content is stable across strategies - only framing, depth, and structure differ. The LLM is not confabulating different demographic realities depending on how it is prompted.
Bias Audit
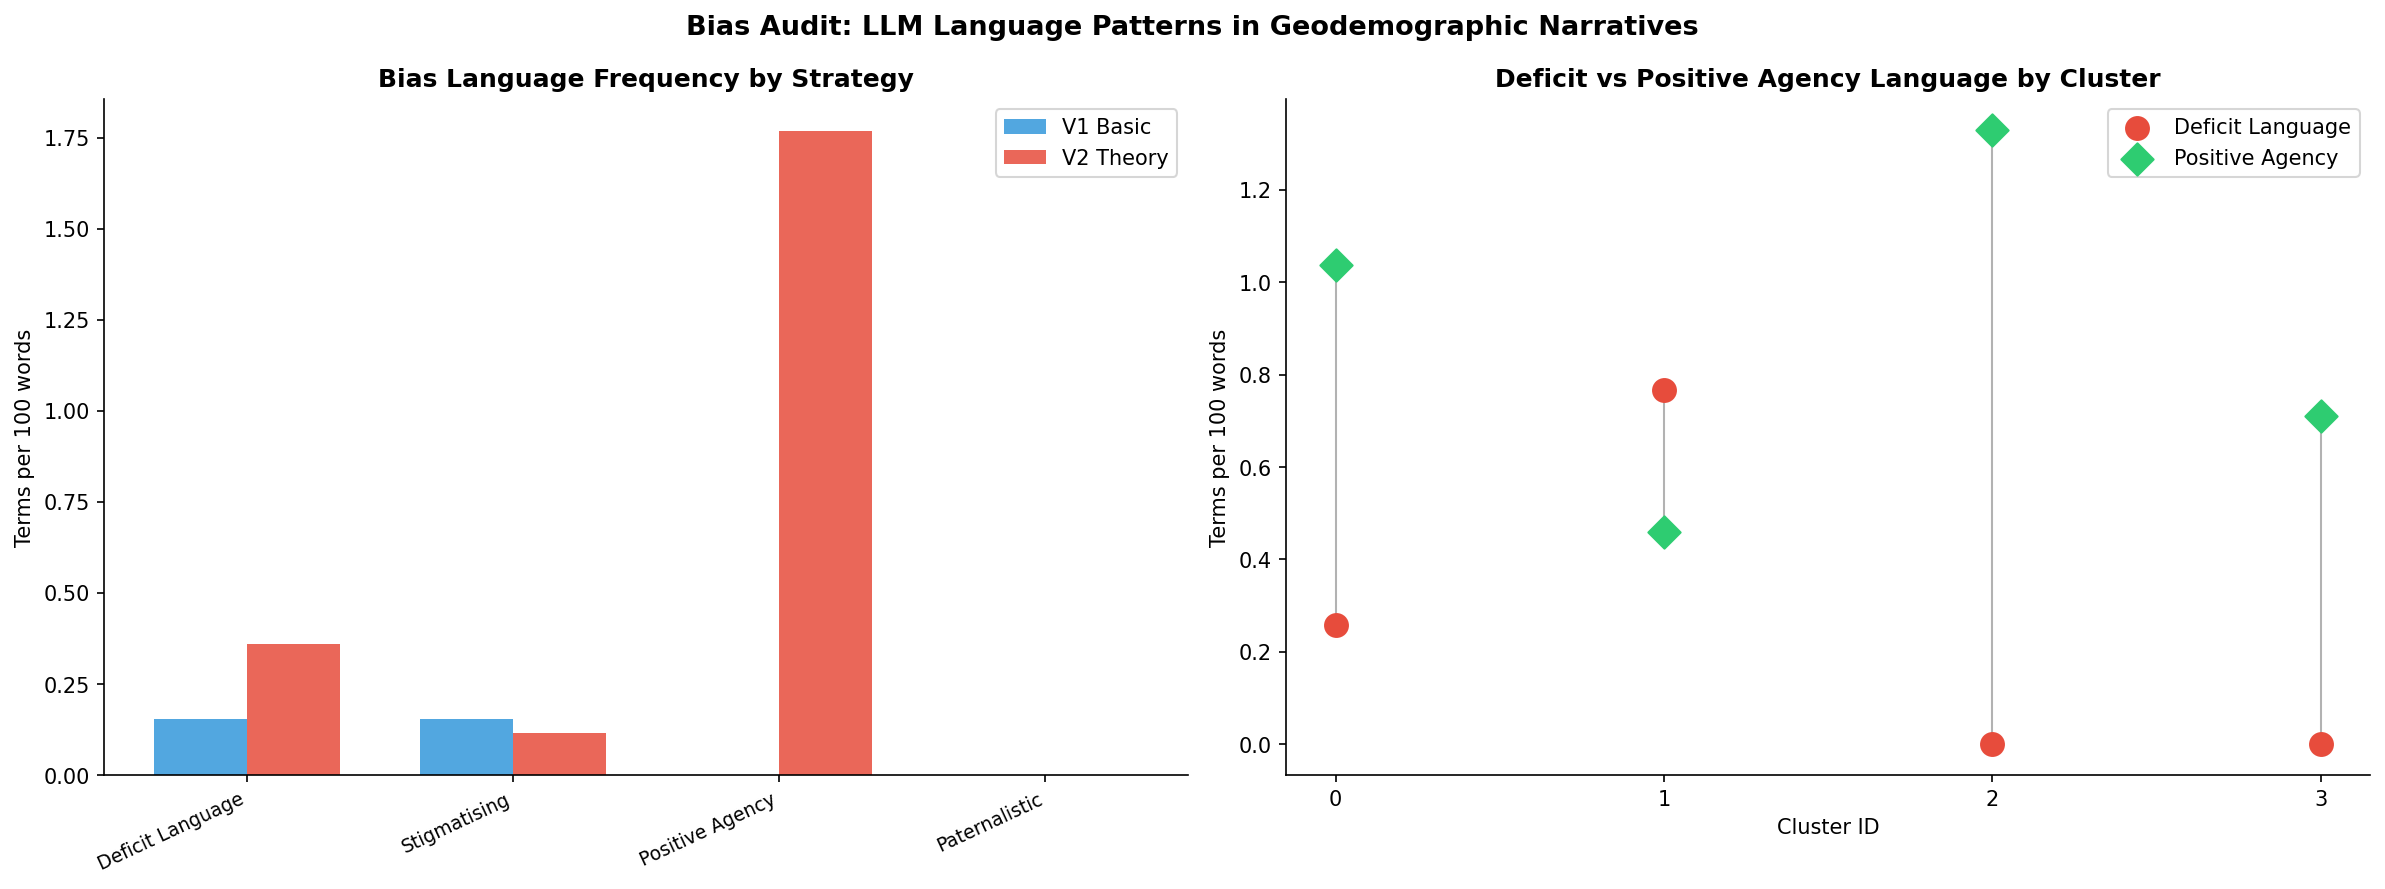
Lexical frequency analysis across four language categories - deficit, stigmatising, positive agency, paternalistic - shows that V2 (Theory-Grounded) uses positive agency language at 10x the rate of V1 Basic (1.75 vs 0.00 terms per 100 words) while only marginally increasing deficit language. Theoretical framing actively redirects the model from describing what is wrong toward describing trajectory and opportunity.
The right panel reveals that deficit language peaks for Cluster 1 - empirically defensible, but confirming the risk of compounding the existing stigmatisation of the Bihar/UP/Jharkhand belt in public discourse.
Factual Accuracy
V3 transition stage predictions vs data-derived ground truth:
| Cluster | LLM Label | True Stage | V3 Prediction | Result |
|---|---|---|---|---|
| 0 | Mid-Transition Northeast and UP Districts | Mid | Mid | ✅ |
| 1 | High Fertility, Low Education Transition Zone | Early | Early | ✅ |
| 2 | Mid-Transition High Institutional Care Districts | Mid | Mid | ✅ |
| 3 | Advanced Transition, Persistent Health Gaps | Late | Late | ✅ |
100% accuracy across all four clusters. The model also independently flagged the Cluster 3 vaccination anomaly before any manual review.
Key Findings
1. India’s demographic diversity is far greater than state-level averages suggest The four-cluster solution reveals qualitatively different demographic trajectories - not gradations of a single development axis. Cluster 0 (Northeast + UP) defies a simple “high-burden” framing despite geographic overlap with nationally disadvantaged states.
2. Immunisation infrastructure is an untapped integration platform in highest-burden districts Cluster 1 (Bihar/UP/Jharkhand/Assam) shows a full vaccination index of 292 - nearly three times the national average - despite being the most educationally and reproductively disadvantaged cluster. Community health worker networks already reach these districts for immunisation; that infrastructure has not been leveraged for integrated FP and maternal health services.
3. Health service delivery is outpacing human capital formation in mid-transition India Cluster 2 shows near-complete institutional birth coverage and above-average vaccination, but only 32.8% of women have 10+ years of schooling. The demographic dividend risks being partially rather than fully realised unless structural investment in girls’ education and nutrition catches up with health system progress.
4. Prompt engineering strategy substantially changes LLM output quality and ethical risk Moving from V1 (basic) to V2 (theory-grounded) increases positive-agency language 10-fold with no meaningful cost to semantic accuracy or consistency. For policy communication applications, theoretical grounding in the prompt is not optional.
5. Structured bias-aware prompting provides meaningful automated quality assurance
V3’s bias_flag outputs independently identified BIMARU-region stigmatisation risk for Cluster 1 and flagged the impossible vaccination score for Cluster 3 - findings that would require deliberate expert effort to catch manually.
6. LLM factual accuracy is high when data is cleanly structured and theoretically anchored 100% correct transition stage classification across all clusters, with no hallucinated claims identified in V3 outputs when checked against source data.
Project Structure
geodemographic-india-llm/
│
├── README.md                                        <- This file
├── geodemographic_india_llm.ipynb                   <- Full analysis notebook (Google Colab)
│
├── data/
│   └── NFHS_5_India_Districts_Factsheet_Data.xls   <- Download separately (see Datasets above)
│
└── outputs/
    ├── india_geodemographic_classification.csv      <- 694 districts with cluster labels + all 19 indicators
    ├── llm_narratives.csv                           <- Raw LLM outputs: 4 clusters x 3 strategies
    ├── india_geodemographic_interactive.html        <- Interactive Folium map - open in any browser
    ├── main_figure.png                              <- 5-panel publication figure
    ├── cluster_heatmap.png                          <- Full 19-variable index score heatmap
    ├── bias_audit.png                               <- Bias language frequency analysis
    └── semantic_consistency.png                     <- Cross-strategy cosine similarity
Output file guide:
| File | Contents |
|---|---|
india_geodemographic_classification.csv |
Every district: cluster ID, LLM label, transition stage, dividend potential, all 19 NFHS-5 indicator values |
llm_narratives.csv |
All LLM outputs: raw text, token counts, V3 JSON responses |
india_geodemographic_interactive.html |
Interactive choropleth - hover any district for cluster and key indicators - Open Live Portal → |
main_figure.png |
Five-panel summary: India map · index heatmap · semantic consistency · bias audit · accuracy |
cluster_heatmap.png |
Full 19-variable x 4-cluster index score grid with domain boundary lines |
bias_audit.png |
Deficit vs positive-agency language by strategy (left) and by cluster (right) |
semantic_consistency.png |
Pairwise cosine similarity between V1/V2/V3 narratives per cluster |
🗺️ The interactive choropleth renders as a fully functional district-level exploration portal - open it in any browser to hover over all 707 districts and query cluster assignments, indicator values, and state breakdowns in real time: Live Portal
To activate: repo Settings → Pages → Deploy from branch → main → Save. Goes live in ~2 minutes.
How to Reproduce
Step 1 - Download the data
Save the file as data/NFHS_5_India_Districts_Factsheet_Data.xls
Step 2 - Get an Anthropic API key
Create an account and add credits. Estimated cost for this project: $0.10-0.25 USD (12 LLM calls total).
Step 3 - Open in Google Colab
Upload geodemographic_india_llm.ipynb → add key via Colab → Secrets (🔑) → ANTHROPIC_API_KEY
Step 4 - Run all cells
Estimated runtime: 45-60 minutes on Colab Pro. Cell 25 triggers automatic download of all outputs.
Dependencies
pip install anthropic geopandas mapclassify folium sentence-transformers \
            scikit-learn pandas numpy matplotlib seaborn xlrd openpyxl requests
References
1. Demographic Transition and the Dividend
Bloom, D. E., Canning, D., & Sevilla, J. (2003). The demographic dividend: A new perspective on the economic consequences of population change. RAND Corporation. https://doi.org/10.7249/MR1274
Bloom, D. E., Canning, D., Fink, G., & Finlay, J. E. (2009). Fertility, female labor force participation, and the demographic dividend. Journal of Economic Growth, 14(2), 79-101.
Reher, D. S. (2011). Economic and social implications of the demographic transition. Population and Development Review, 37(Supplement), 11-33.
2. Geodemographic Classification Methodology
Vickers, D., & Rees, P. (2007). Creating the UK National Statistics 2001 output area classification. Journal of the Royal Statistical Society: Series A (Statistics in Society), 170(2), 379-403. https://doi.org/10.1111/j.1467-985X.2007.00466.x
Singleton, A., & Spielman, S. E. (2014). The past, present, and future of geodemographic research in the United States and United Kingdom. The Professional Geographer, 66(4), 558-567.
Singleton, A., & Spielman, S. E. (2026). Geodemographics and residential differentiation: A methodological review and future directions for learned representations of the social landscape. Computers, Environment and Urban Systems, 125, 102396.
Gale, C. G., Singleton, A., Bates, A. G., & Longley, P. A. (2016). Creating the 2011 area classification for output areas (2011 OAC). Journal of Spatial Information Science, 12, 1-31.
3. Data Source
International Institute for Population Sciences (IIPS) & ICF. (2021). National Family Health Survey (NFHS-5), 2019-21: India. Ministry of Health and Family Welfare, Government of India. https://dhsprogram.com/pubs/pdf/FR375/FR375.pdf
Ministry of Health and Family Welfare & IIPS. (2022). National Family Health Survey-5 (2019-21): India districts factsheet data. Government of India Open Data Platform. https://www.data.gov.in/catalog/national-family-health-survey-5-nfhs-5-india-districts-factsheet-data-provisional
4. LLM Geographic and Demographic Bias
Manvi, R., Khanna, S., Burke, M., Lobell, D., & Ermon, S. (2024). Large language models are geographically biased. Proceedings of the 41st International Conference on Machine Learning (ICML 2024), pp. 34654-34669. arXiv:2402.02680
Bai, H., et al. (2024). Bias in large language models: Origin, evaluation, and mitigation. arXiv:2411.10915
Faisal, F., & Anastasopoulos, A. (2023). Geographic and geopolitical biases of language models. Proceedings of the 3rd Workshop on Multi-lingual Representation Learning (MRL), Association for Computational Linguistics. https://aclanthology.org/2023.mrl-1.12
5. Prompt Engineering and LLM Evaluation
Wei, J., Wang, X., Schuurmans, D., Bosma, M., Ichter, B., Xia, F., Chi, E., Le, Q. V., & Zhou, D. (2022). Chain-of-thought prompting elicits reasoning in large language models. Advances in Neural Information Processing Systems (NeurIPS), 35, 24824-24837.
White, J., Fu, Q., Hays, S., Sandborn, M., Olea, C., Gilbert, H., … & Schmidt, D. C. (2023). A prompt pattern catalog to enhance prompt engineering with ChatGPT. arXiv:2302.11382
6. Semantic Similarity and Evaluation
Reimers, N., & Gurevych, I. (2019). Sentence-BERT: Sentence embeddings using Siamese BERT-networks. Proceedings of the 2019 Conference on Empirical Methods in Natural Language Processing and the 9th International Joint Conference on Natural Language Processing (EMNLP-IJCNLP), pp. 3982-3992. Association for Computational Linguistics. https://aclanthology.org/D19-1410
7. AI in Development and Policy Communication
Bender, E. M., Gebru, T., McMillan-Major, A., & Shmitchell, S. (2021). On the dangers of stochastic parrots: Can language models be too big? Proceedings of the 2021 ACM Conference on Fairness, Accountability, and Transparency (FAccT), pp. 610-623.
Floridi, L., et al. (2022). An ethical framework for a good AI society: Opportunities, risks, principles, and recommendations. In Ethics, Governance, and Policies in Artificial Intelligence, Springer, pp. 19-39.
Data: NFHS-5 (2019-21), Government of India · Boundaries: Census 2011, Survey of India · LLM: Anthropic Claude API · Analysis: Python · GeoPandas · Scikit-learn